Avevo già salvato, ridotto e smembrato il pdf sabato mattina, pronto a commentare all’insegna di “una bella fotografia“, poi ho trovato l’articolo di Michele Ferrari che smonta il valore del test, non dirimente, riconoscendo alcune eccezionalità all’atleta. Sistemo l’unità di misura (w => W), tolgo lo spazio dal valore all’unità, lascio il vezzo english di separare i decimali con ‘.’ invece che ‘,’ e la data mese/giorno/data. Per il resto un’altra lezione magistrale.
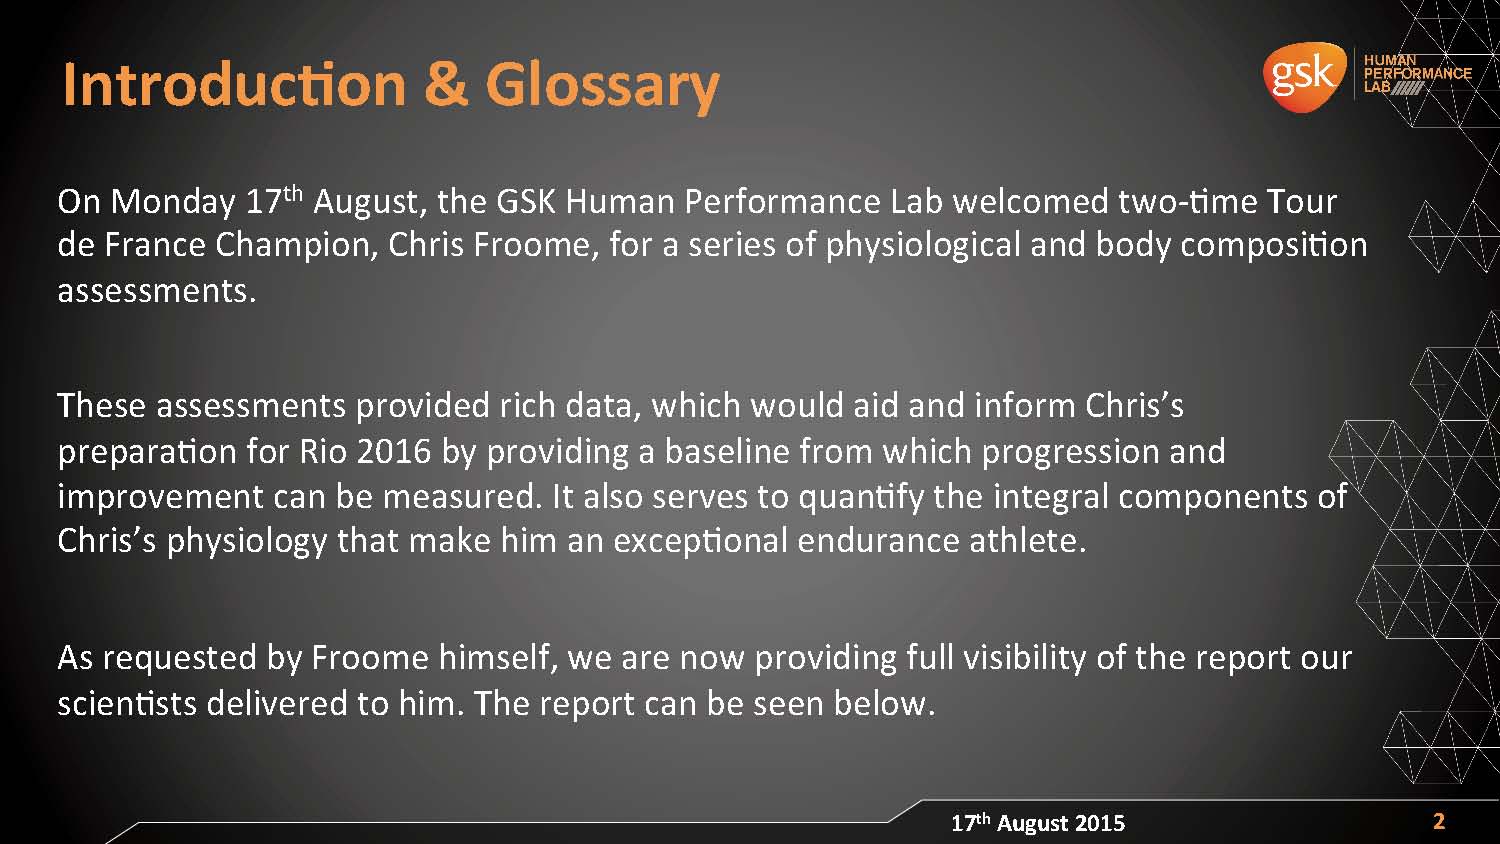
Three weeks after the victorious TdF 2015, forced by the inevitable suspicions of doping, Chris Froome was submitted to a lab test at the GSK Human Performance Lab in London. It took more than 100 days for his entourage to filter and make the results finally public. The report presents all the limitations of a test carried out in a laboratory, but some information is interesting.
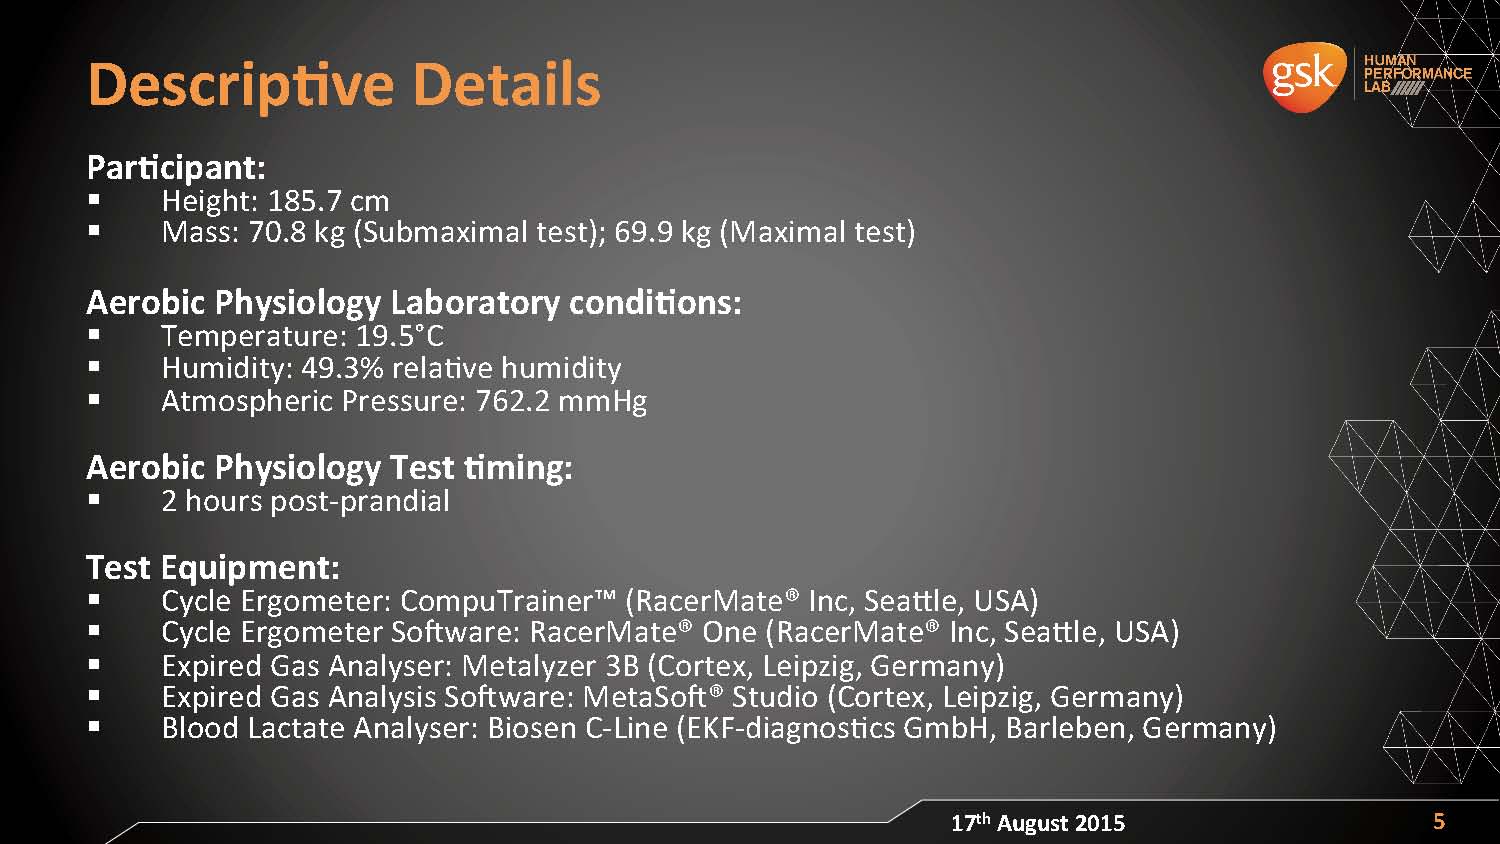
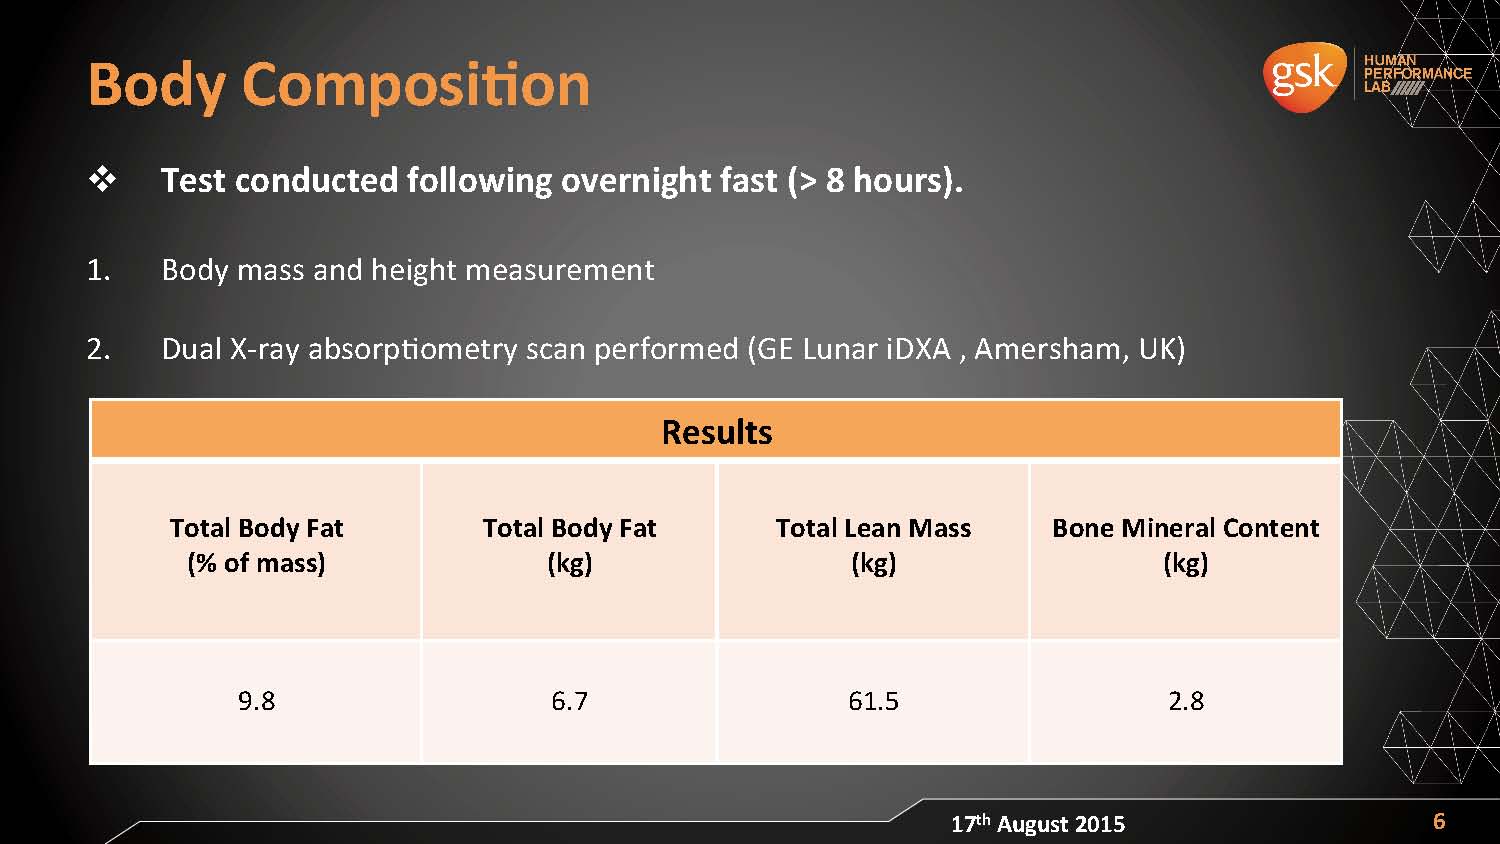
Prior to the actual performance testing, Froome was recorded to have a weight of 70.8kg (9.8% fat), a whopping 3.8kg above the weight declared at the TdF (67kg), which is basically like saying that, after the 3-week stage race, he accumulated an average of 180g of weight per day, corresponding to an overfeeding of 1628 Kcal per day. A real sponge, which is suggesting of previous important caloric restrictions.
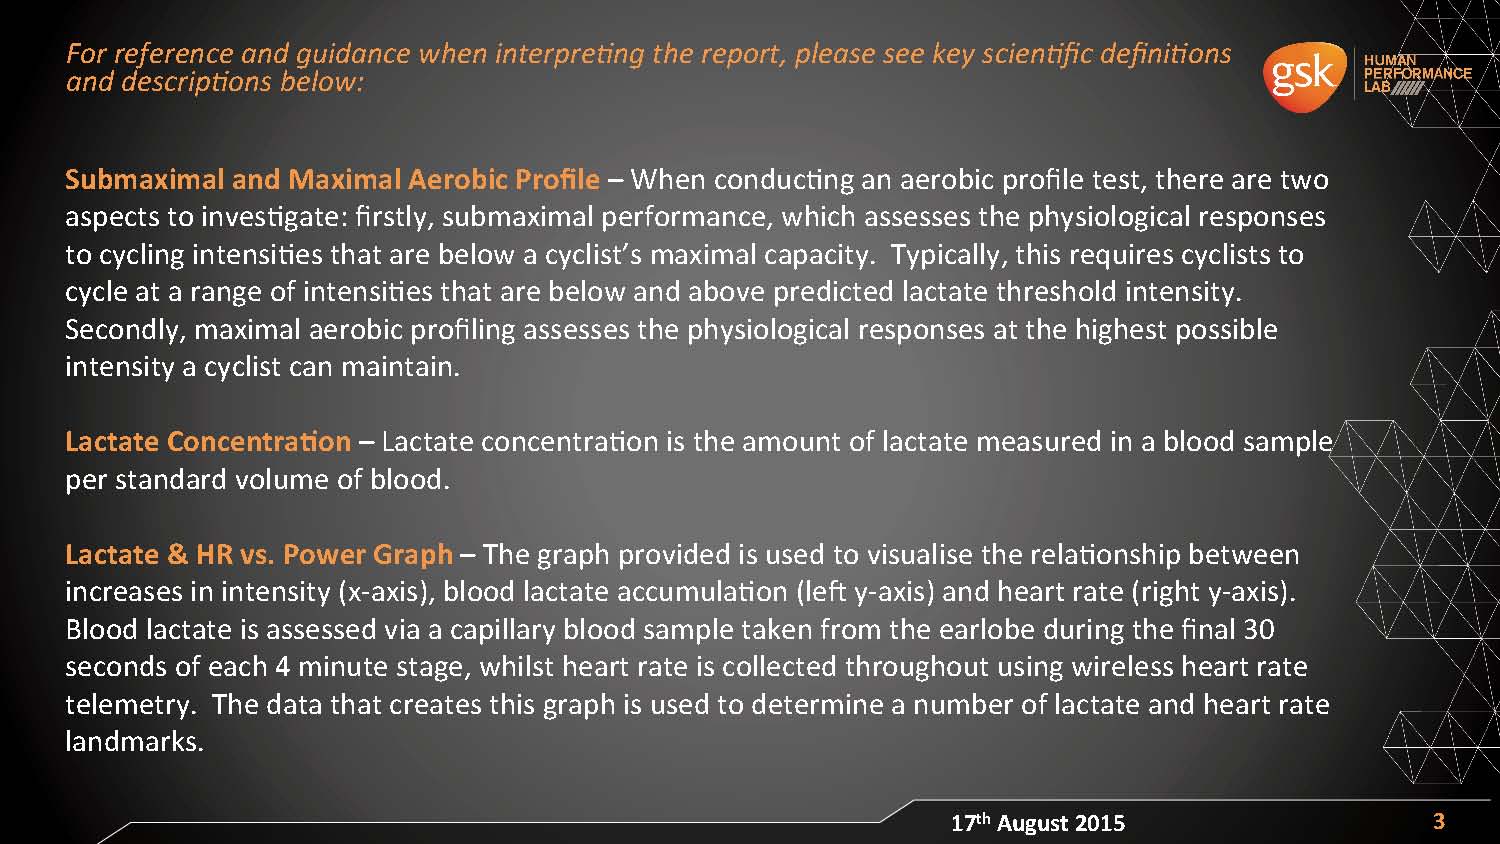
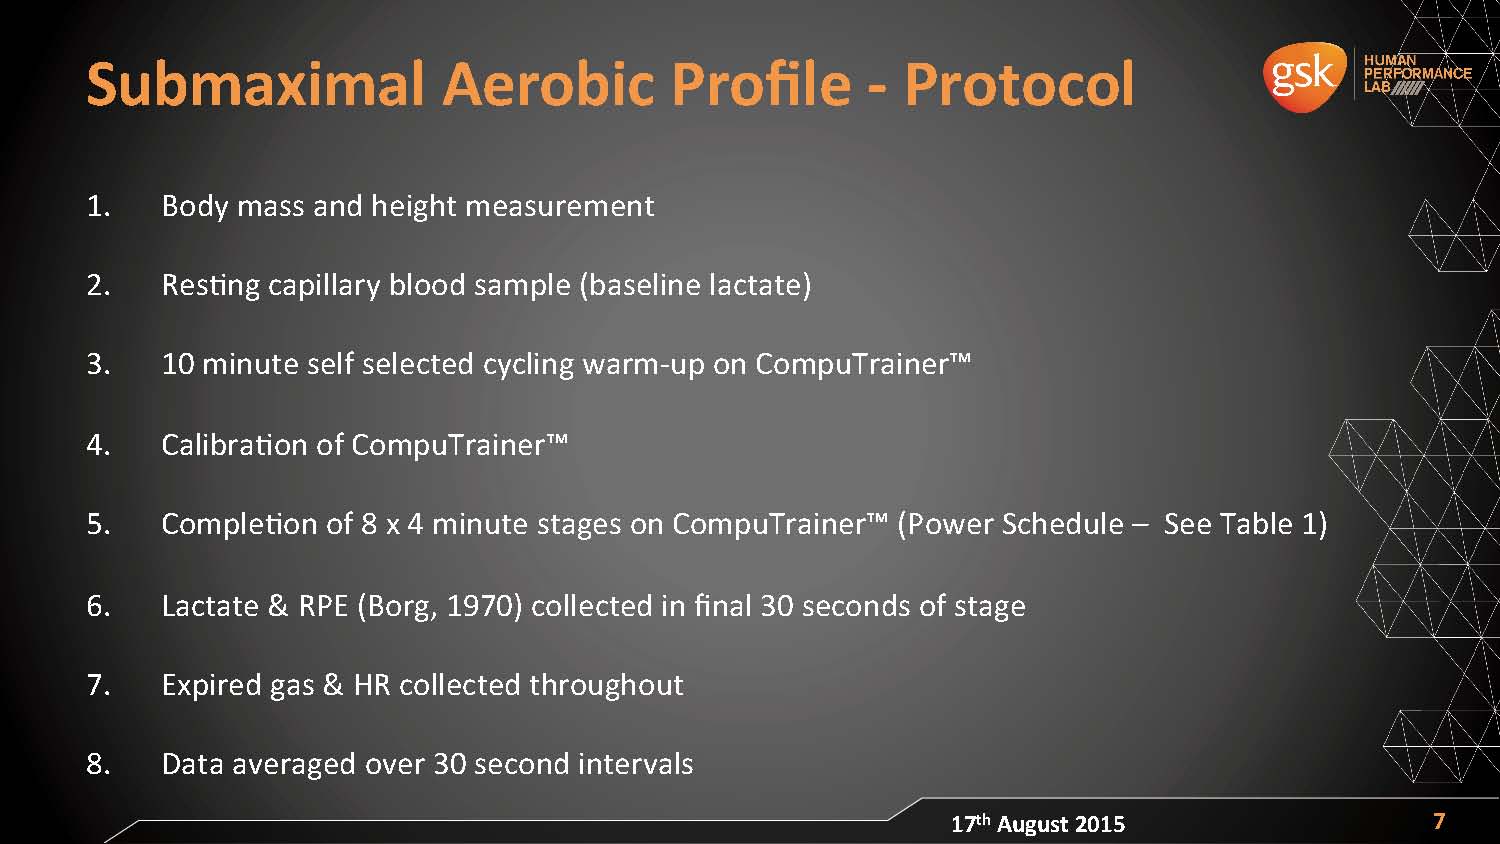
After only 10min (sic) of warm-up, Chris was subjected to a “sub-maximal aerobic test”: 8x 4min starting from 250W, with steps of 25w, up to a maximum of 425W. The pedaling cadence was not given, a fundamental parameter for evaluating cycling performances, those of Chris Froome in particular.
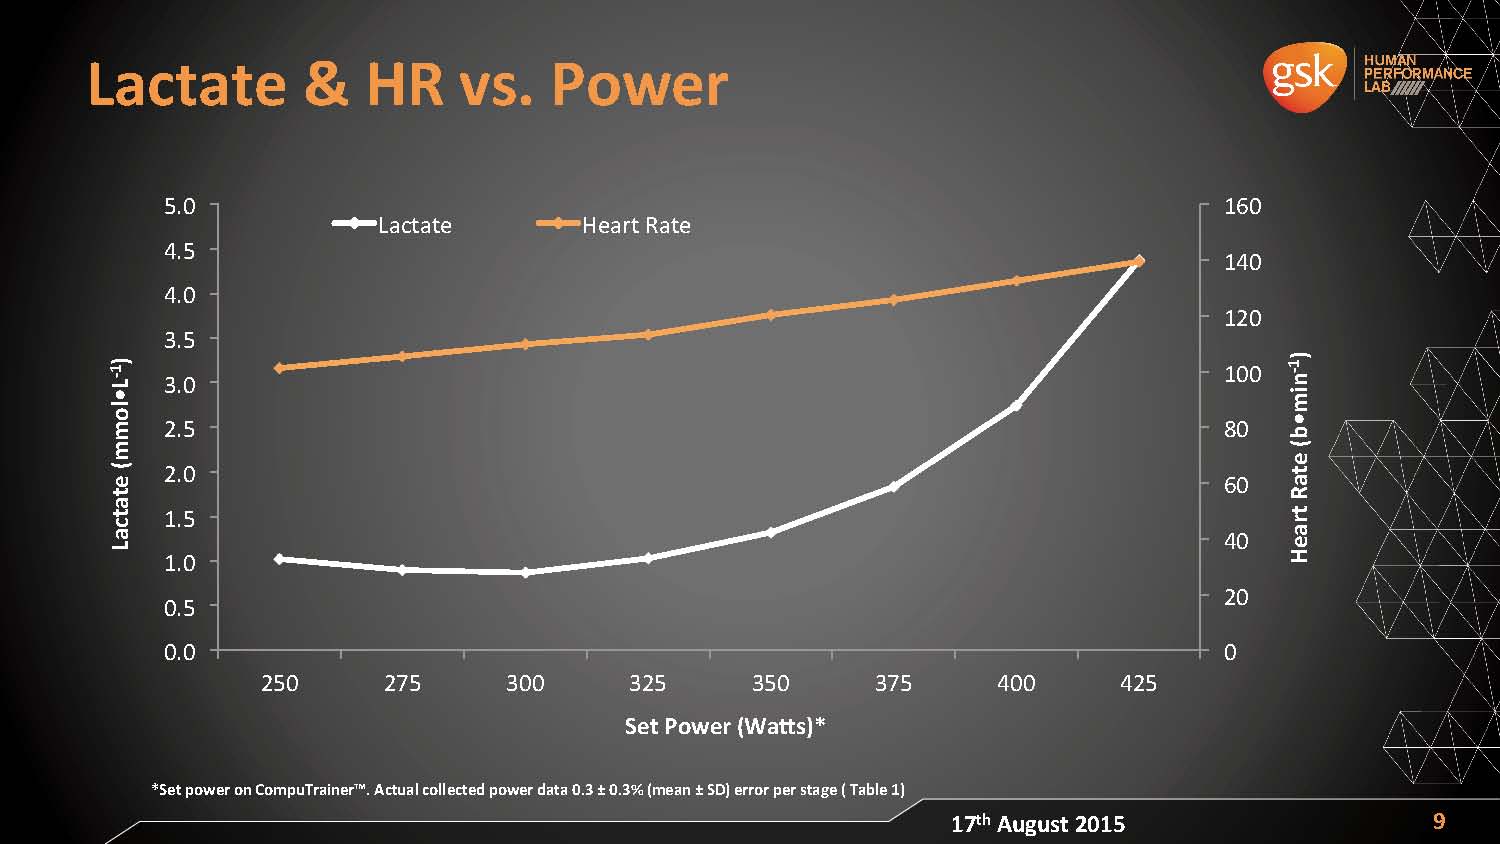
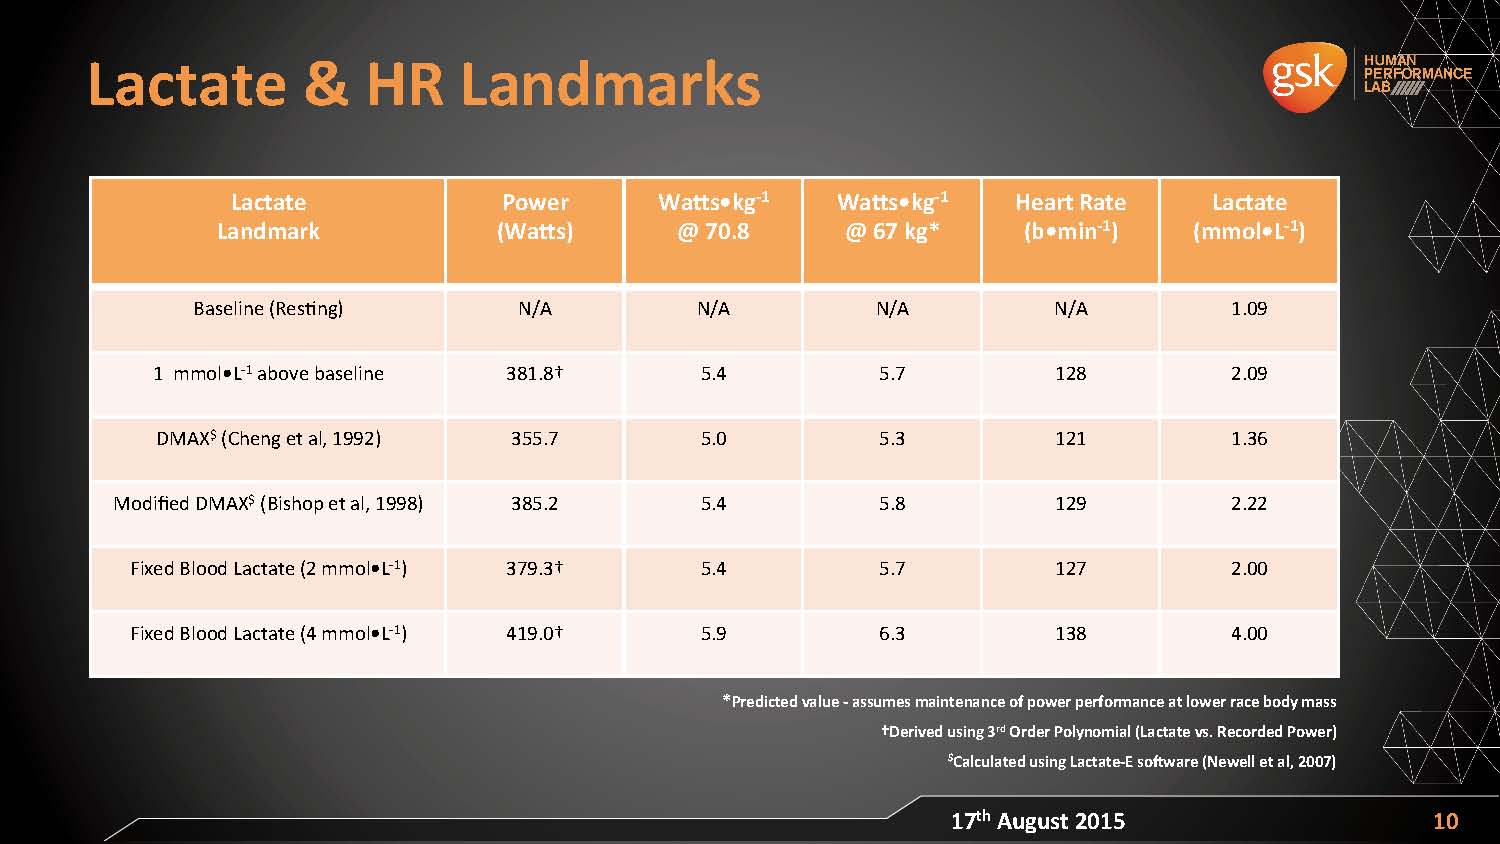
It is not so much the values of AT2 = 379W and AT4 = 419W that grab my attention, but their Heart Rate values: 127 and 138bpm respectively, compared with a HRmax of around 175bpm, as reported by Froome himself. The Report, seriously lacking, does not mention the value of HR max reached in the next test (VO2max).
But even more surprising is the modest increase of Heart Rate in the progression from 250W to 425W: about 35bpm (the Report does not show the exact data), equal to 5.0W/beat, which shows a cardiac efficiency truly above average; this in my opinion is the most significant data out of all the testing.
The value of AT4 = 419W is definitely an underestimation by approximately 10% of the value recorded by Froome in a road test: in his autobiography “The Climb”, Chris himself wrote he climbed the Col De La Madone in 30’09”, six days before the start of the TdF 2013, developing an average FTP of 459w (6.85W/kg with his TdF weight) …
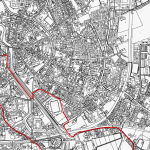
Just to satisfy the curiosity, here are the times and relevant wattages recorded by some of the best cyclists in recent years on the Col De La Madone (13.1km at an average gradient of 7%)
- Richie Porte – 62kg (2014) in 29’40” – 431W – 6.96W/kg
- Chris Froome – 67kg (2013) in 30’09” – 459W – 6.85W/kg
- Tom Danielson – 59.5kg (2006) in 30’24” – 410W – 6.89W/kg
- Lance Armstrong – 74.5kg (1999) in 30’47” – 492W – 6.60W/kg
- Lance Armstrong – 75kg (2005) in 31’11” – 488W – 6.50W/kg
- Lance Armstrong – 75kg (2010) in 32’20” – 479W – 6.38W/kg
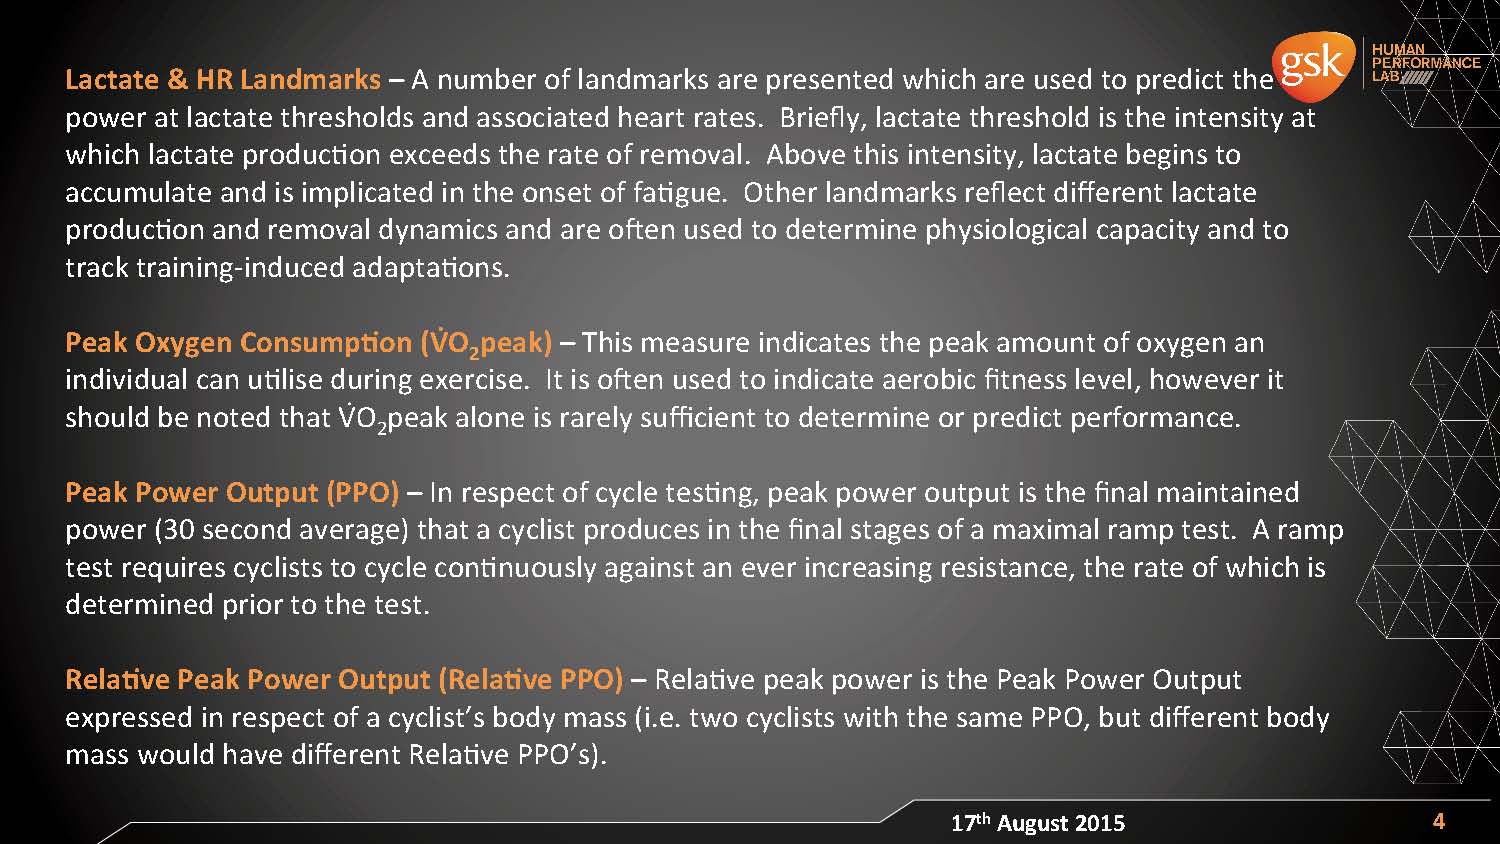
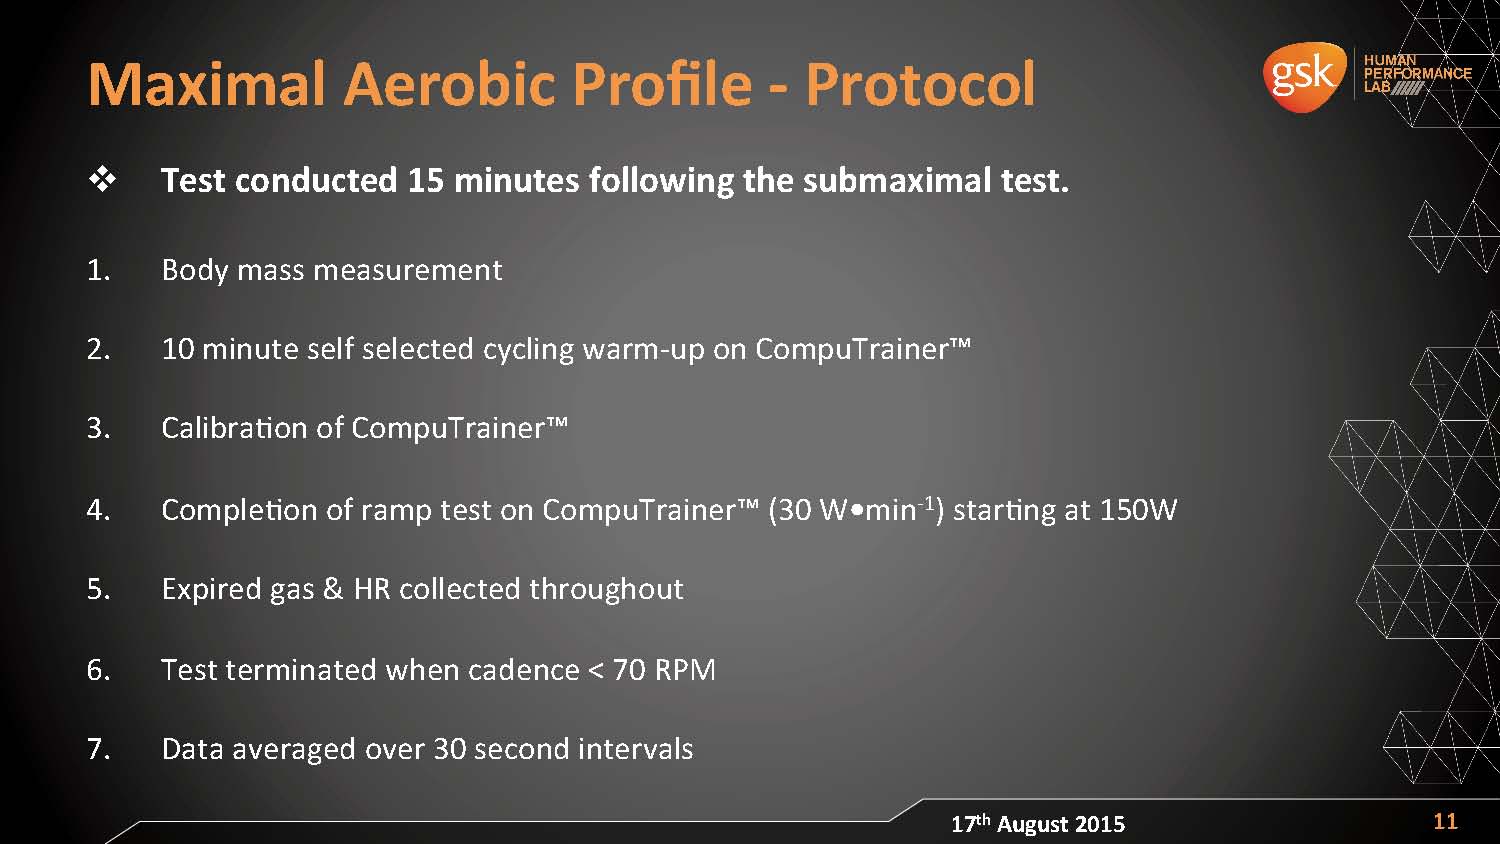
15min after the “sub-maximal aerobic test”, Froome performed the “incremental maximal test”, starting from 150W with increments of 30W/min and measurement of oxygen consumption (VO2) taken on the average of 30″. Again the cadence is completely unreported, if not for the fact that the test gets interrupted when the pedaling falls below 70rpm. The same omission is repeated with regards to the HR max achieved in the test.
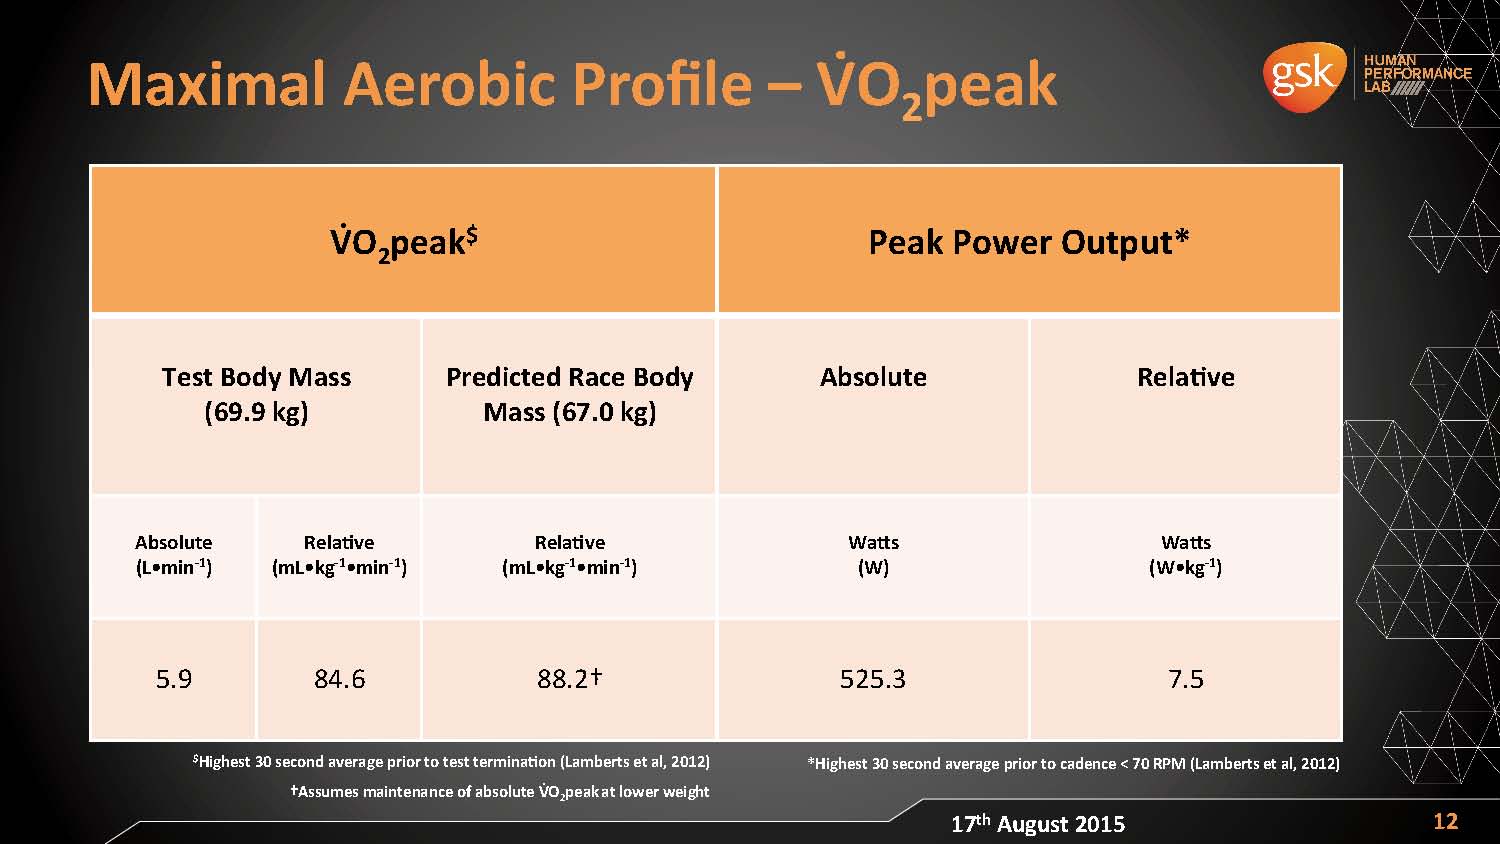
VO2max is 5.91 l/min = 84.6 ml/kg/min = 88.2ml/kg/min with TdF weight (67kg). An excellent value, but not significant in predicting performance, as premised by the very same carrying out the testing and as can be so easily guessed by comparing the “stratospheric” 92.0 ml/kg/min attributed to Greg Lemond for his Alpe d’ Huez record (48min in the TdF 1985 together with Bernard Hinault), 10min away from the best times.
The Report also proposes the comparison with the test Froome carried out on 07/25/2007 at the Swiss Olympic Medical Center: 75.6kg, 16.7% body fat, VO2max = 6.07l/min = 80.2ml/kg/min. This is also a value that is higher than the average of the professional cyclists, further confirming the futility of this measurement if we compare it with the inconsistent racing results of Froome back then.
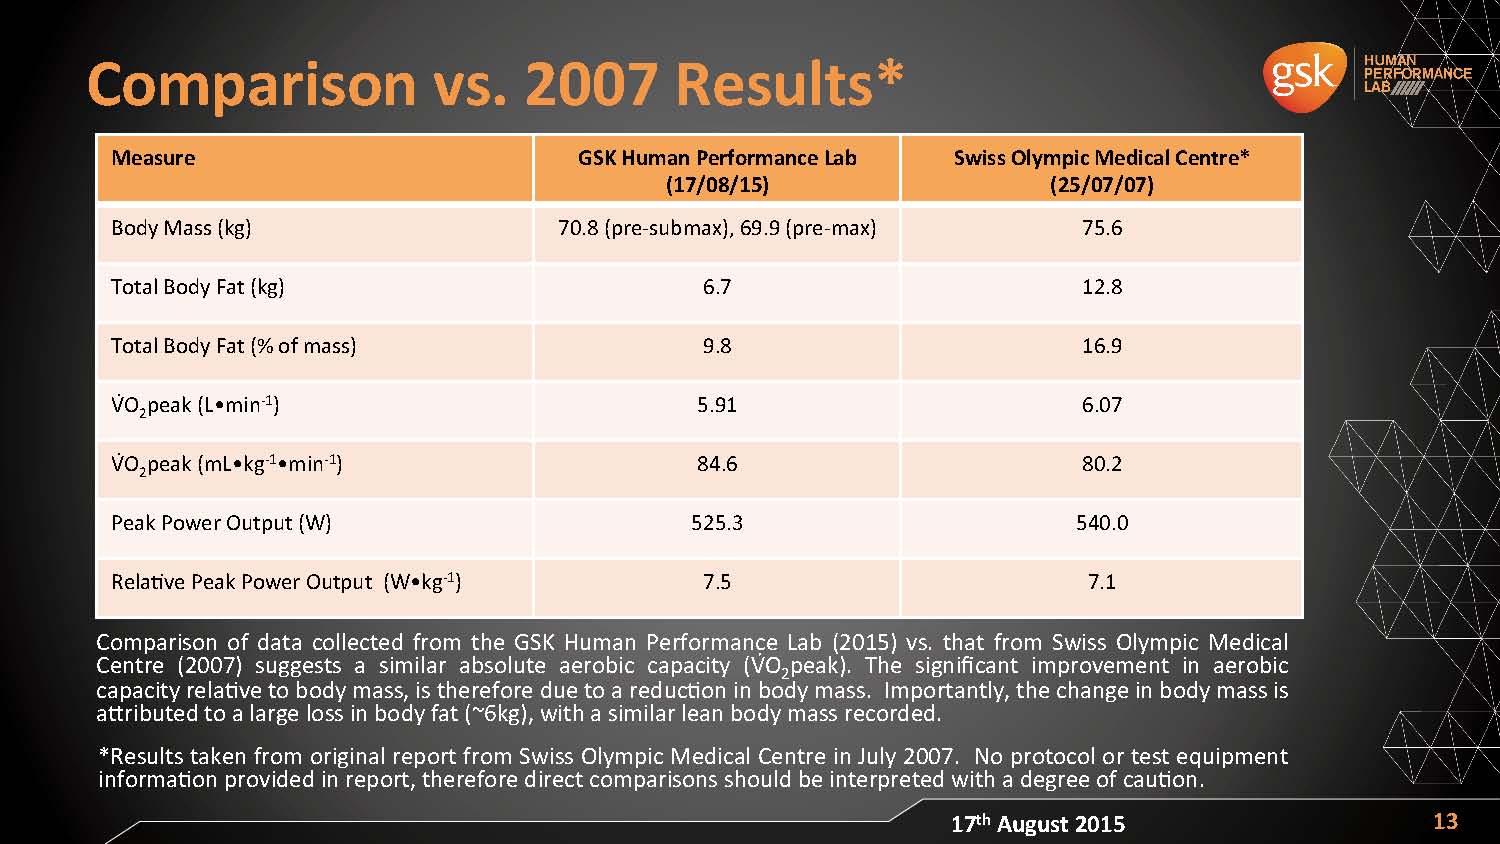
Lastly, one can’t help but smile at the conclusion of the South African physiologist Jeroen Swart: “He just lost the fat”… (a remark I seem to remember I already heard about 16 years ago).
Intanto la Gazzetta continua a seminare notizie fra pubblicazione ven 04, contestazione sab 05 e spiegazione lun 07, lasciando dom 06 al calcio.


Leave A Comment